AI Charting
What is AI Charting?
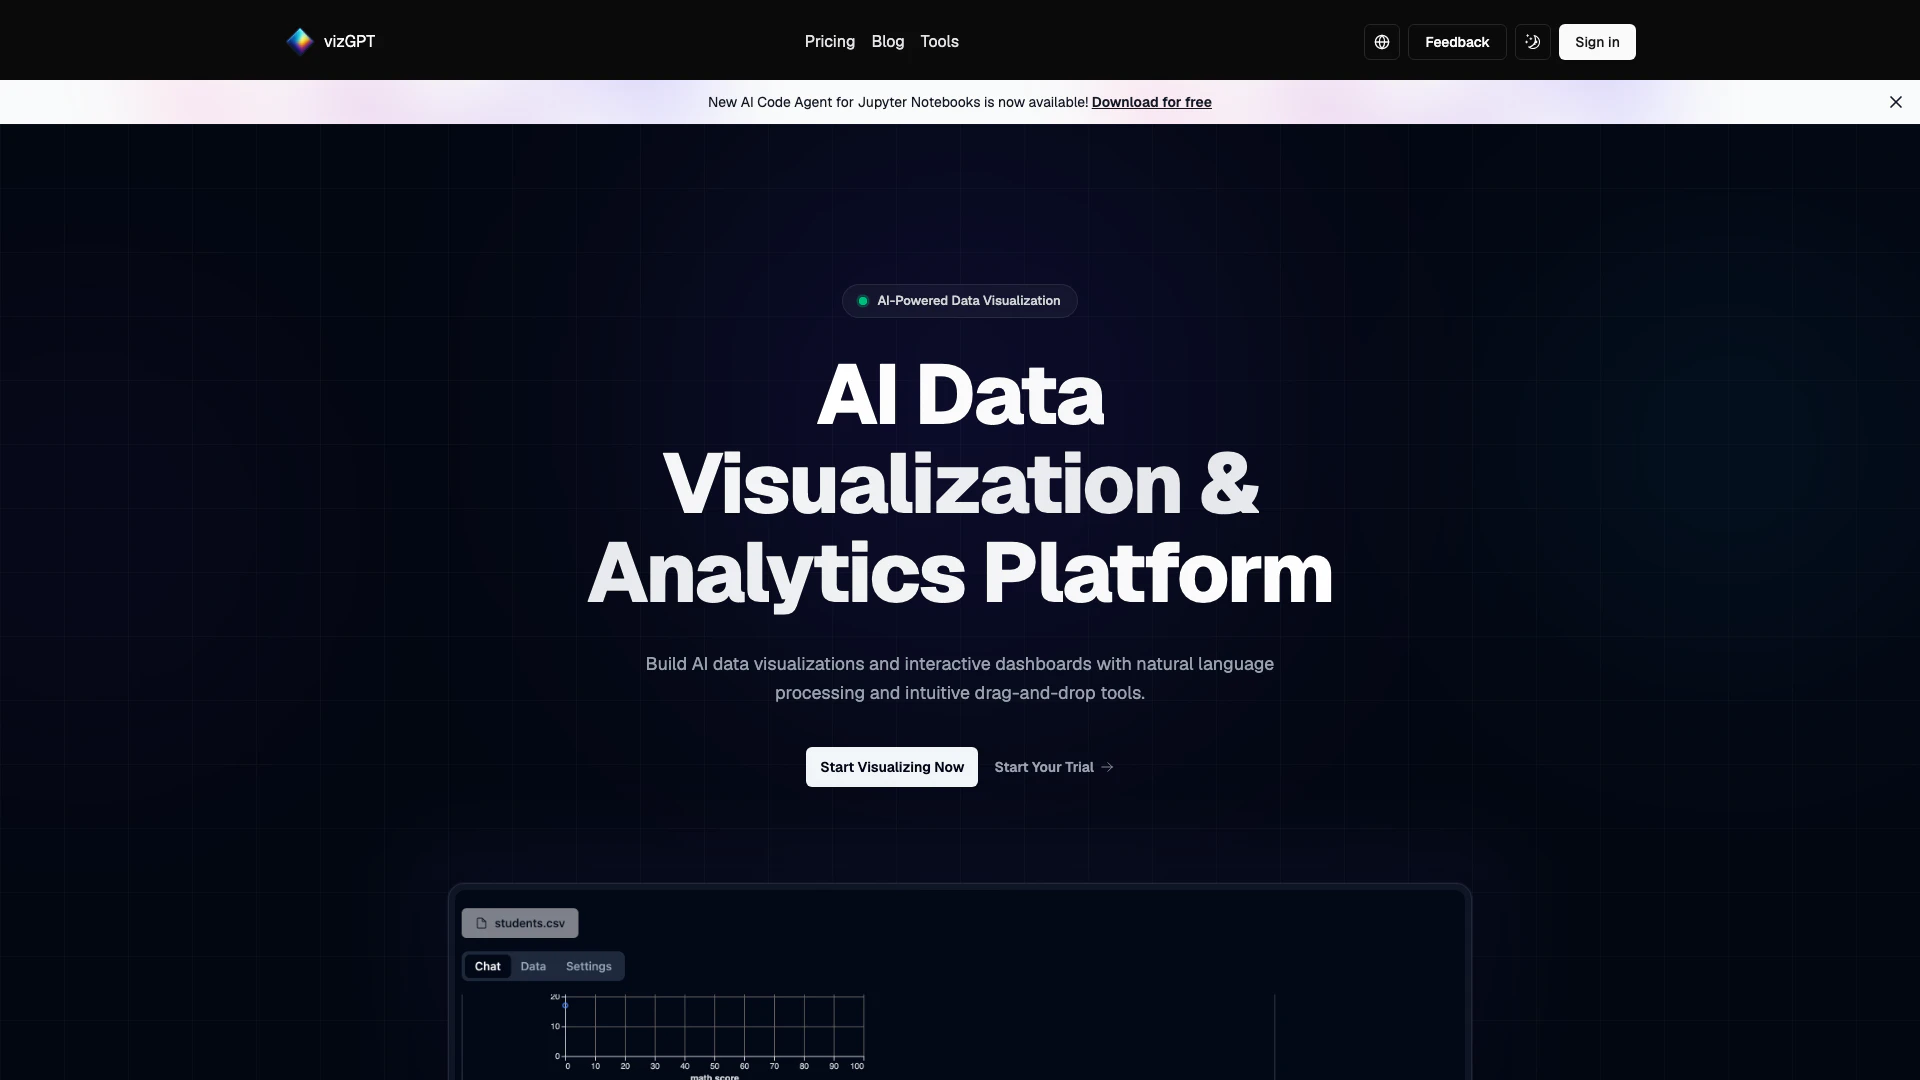
AI Charting, powered by vizGPT, is an innovative AI data visualization agent designed to transform your data into interactive charts and analytics dashboards. Utilizing advanced natural language processing (NLP) and a user-friendly drag-and-drop interface, AI Charting allows users to create visual representations of data simply by asking questions in plain language. This tool is ideal for individuals and teams looking to derive insights from their data without needing extensive coding knowledge, making data analysis accessible and efficient.
How to use AI Charting?
- Sign Up or Log In: Visit the AI Charting website and create an account or log in to your existing account.
- Choose Your Data: Upload your dataset or select from existing data tables available in your workspace.
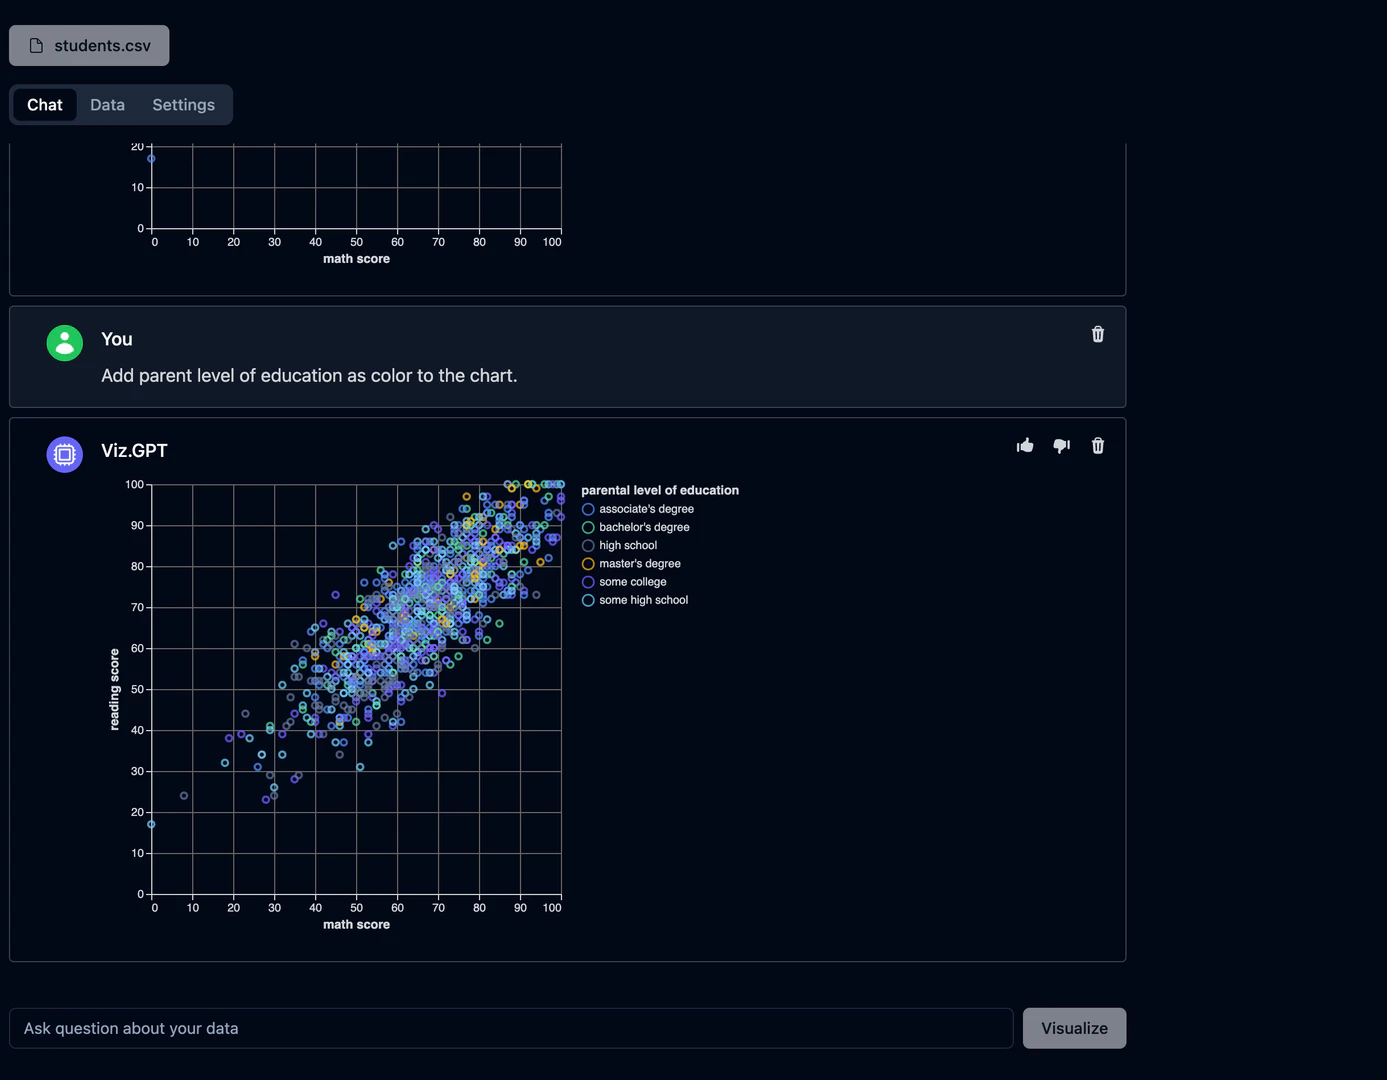
- Interact with the AI: Use the natural language interface to ask questions about your data or use the drag-and-drop feature to build your charts and dashboards.
- Generate Visualizations: The AI will process your queries and generate the corresponding charts and dashboards in real-time.
- Collaborate and Share: Invite team members to view or comment on the visualizations, enhancing collaborative analytics.
What are the main features of AI Charting?
- Natural Language Processing: Engage with your data using simple text queries, eliminating the need for complex syntax.
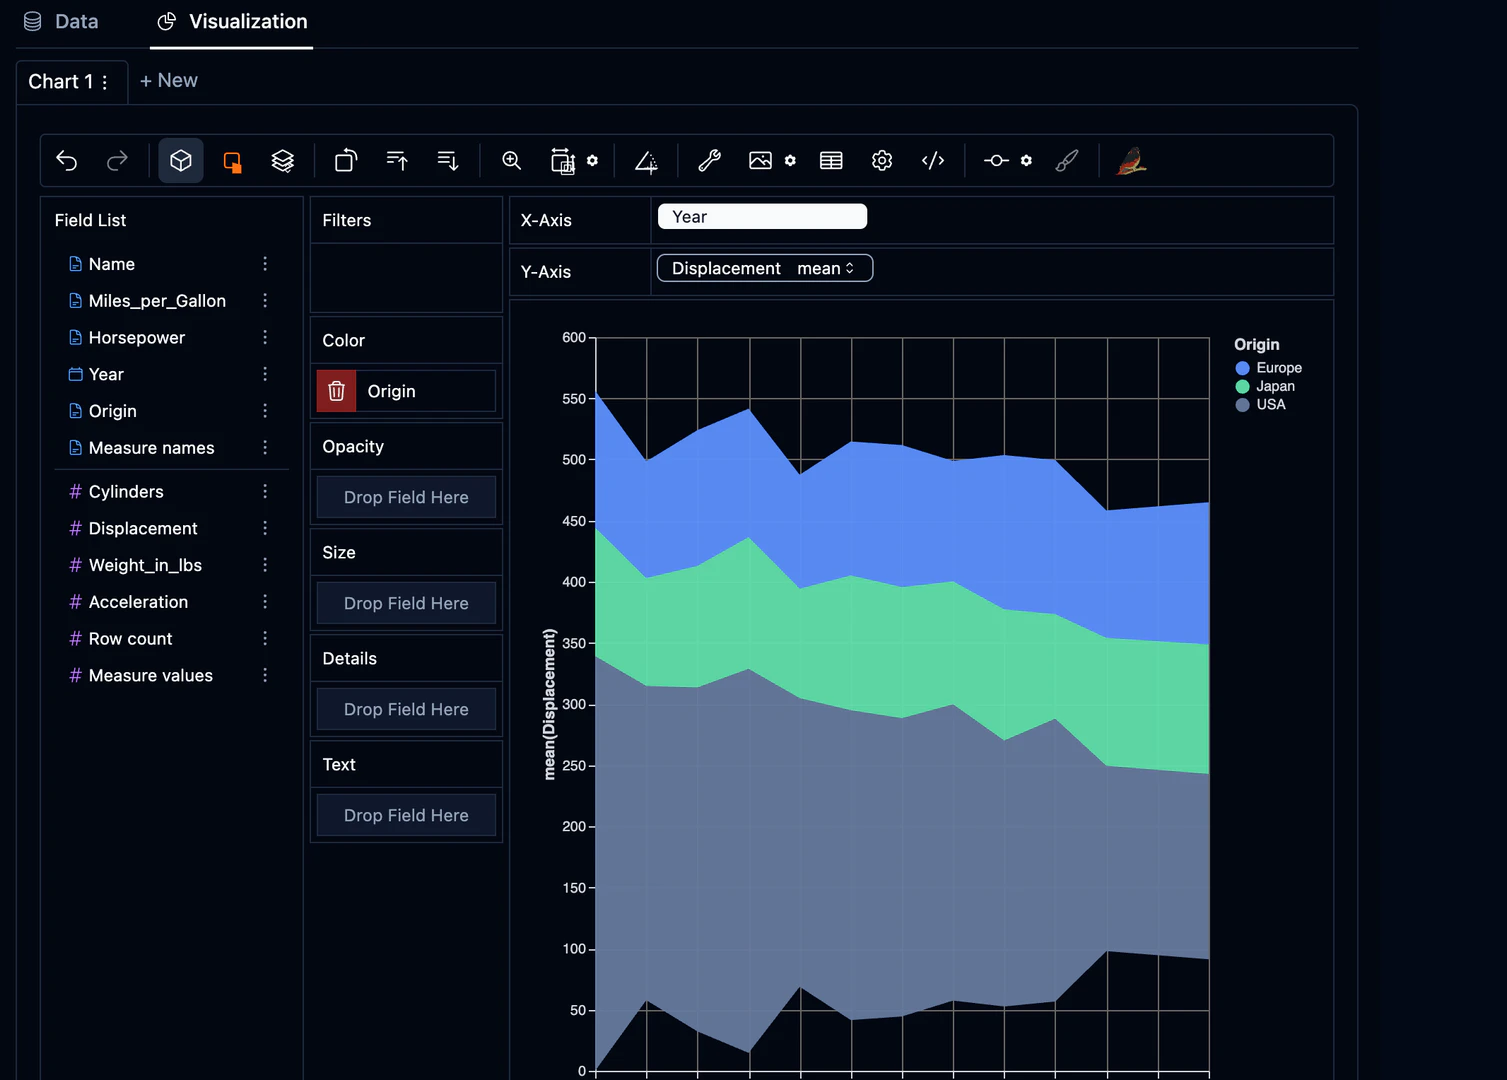
- Drag-and-Drop Interface: Create visualizations intuitively by dragging and dropping elements into your workspace.
- Interactive Dashboards: Build comprehensive dashboards that allow for dynamic data interaction and analysis.
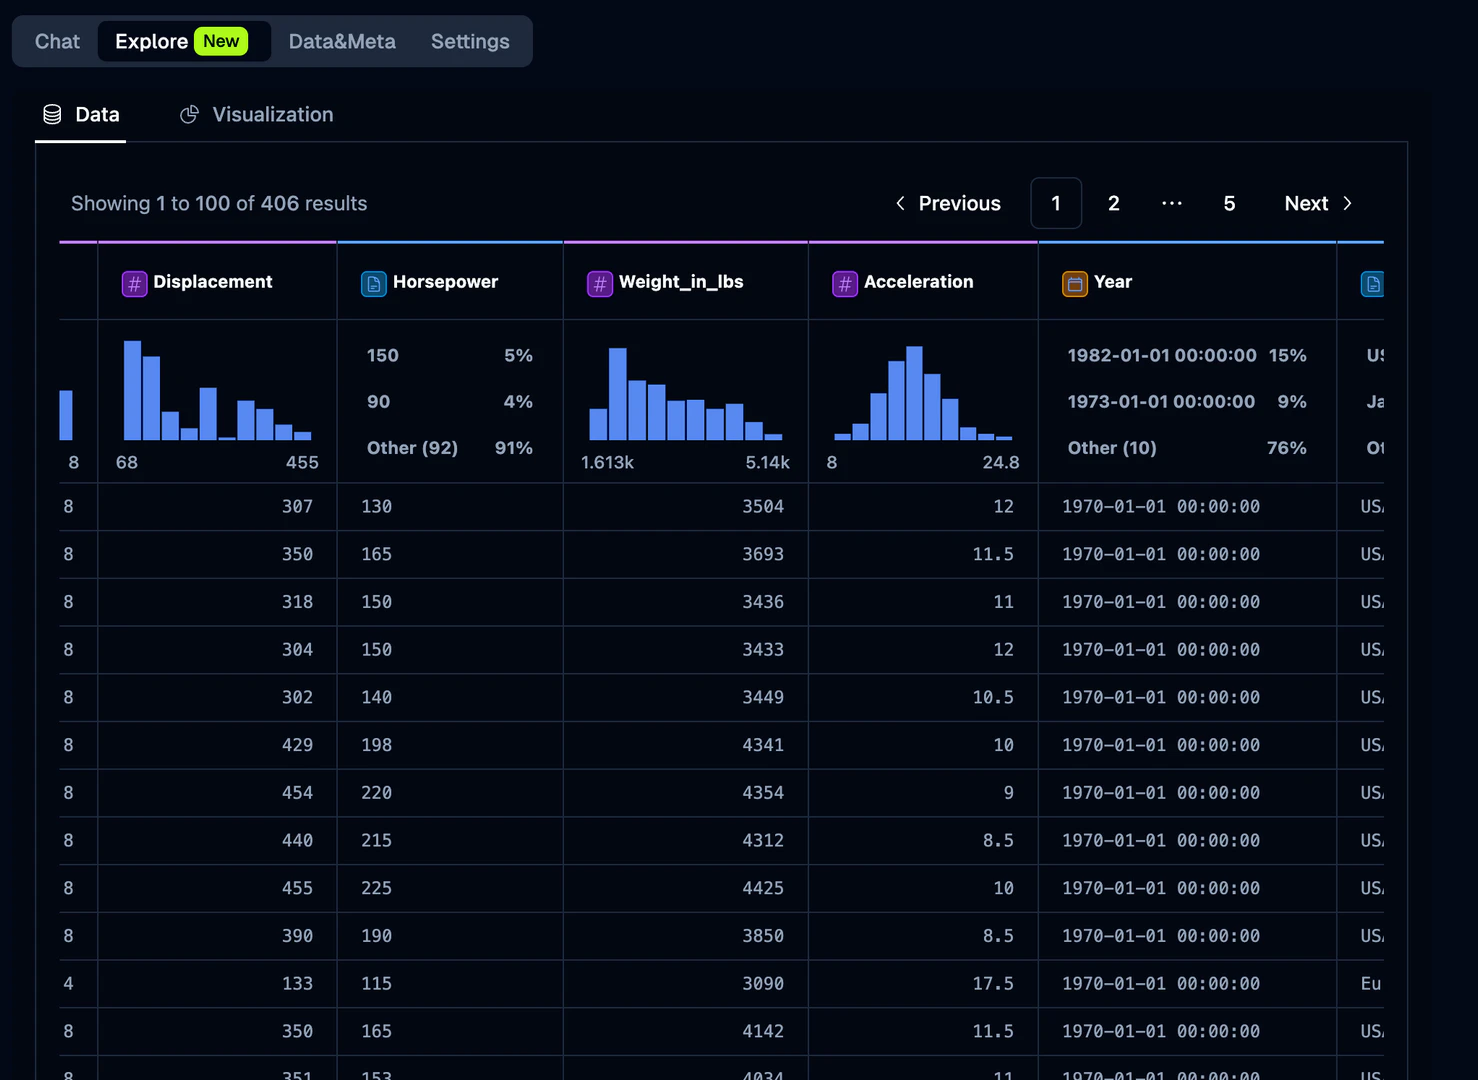
- Data Transformation Tools: Easily transform and profile your data for effective visualization.
- Collaborative Features: Share insights and work together with team members in real-time.
Who is AI Charting for?
AI Charting is designed for data analysts, business intelligence professionals, marketers, and any individuals or teams who need to visualize data effectively. It caters to users with varying levels of technical expertise, from beginners seeking an easy way to create visualizations to advanced users who appreciate the power of AI-driven insights. Organizations aiming to enhance their data storytelling and collaborative analytics will find AI Charting particularly beneficial.
What are the use cases of AI Charting?
- Business Reporting: Generate quick and informative dashboards for presenting business metrics and KPIs to stakeholders.
- Market Analysis: Visualize market trends and consumer behavior data to derive actionable insights for marketing strategies.
- Data Storytelling: Create compelling narratives around data to communicate findings effectively during presentations or meetings.
Product Images

AI Charting Pros and Cons
Pros
- Natural Language Processing: The platform uses advanced NLP to allow users to engage in a conversational manner for data analysis.
- Real-Time Responses: Users can ask a question and get a visualization almost instantly.
- Collaborative Analytics: The tool allows teammates to comment on charts and build dashboards together, enhancing teamwork.
Cons
No cons data detected for this tool
Analytics of AI Charting
AI Charting Website Traffic Analysis
Visits Over Time
Traffic Sources
Oct 2025 - Dec 2025 Worldwide Desktop Only
- Search: 47.38%
- Direct: 40.54%
- Referrals: 7.08%
- Social: 3.80%
- Paid Referrals: 0.84%
- Mail: 0.11%
Top Keywords
| Keyword | Volume | CPC | Estimated Value |
|---|---|---|---|
| mp4 to lottie | 1.50K | $0.47 | $650.00 |
| video to lottie | 620 | $0.00 | $330.00 |
| vizgpt | 430 | $0.00 | $190.00 |
| calculate cgpa from transcript using ai | 310 | $0.00 | $260.00 |
| mp4 to json converter online | 180 | $0.00 | $160.00 |
AI Charting Compare
| Tool Name | Introduction | Pricing | Type | Rating | Launch Date | Learn more |
|---|---|---|---|---|---|---|
Spend less time on marketing with Plai. Advertise like a pro on Google and Facebook, easily find insights, learn new strategies, discover micro-influencers and new keywords for your brand. | Free | -- | June 10, 2025 | Get deal | ||
Just a moment... | Free | -- | October 26, 2020 | Get deal | ||
Create branded videos effortlessly with Shuffll. | Free Trial | 💼Work🎨Creativity | April 19, 2020 | Get deal |
Info current as of post date. Offers and availability may vary by location and are subject to change.
AI Charting Q&A
AI Charting is an AI data visualization and analytics platform that allows you to build visualizations and interactive dashboards using natural language processing and intuitive drag-and-drop tools.
AI Charting Alternatives
Discover Gemini, Google's versatile AI assistant for writing and planning.
- Productivity & Office
- AI Productivity Tools
- AI Business Planning Tools
- AI Prompt Management Tools
Connect with professionals worldwide on LinkedIn.
- Social Media Tools
- AI LinkedIn Headshot Generator
- AI LinkedIn Photo Generator
- AI LinkedIn Conversation Starter Generator